
| Online Judge | Online Exercise | Online Teaching | Online Contests | Exercise Author |
|
F.A.Q Hand In Hand Online Acmers |
Best Coder beta VIP | STD Contests DIY | Web-DIY beta |
Grey Area
Time Limit: 2000/1000 MS (Java/Others) Memory Limit: 32768/32768 K (Java/Others)Total Submission(s): 599 Accepted Submission(s): 371
Problem Description
Dr. Grey is a data analyst, who visualizes various aspects of data received from all over the world everyday. He is extremely good at sophisticated visualization tools, but yet his favorite is a simple self-made histogram generator.
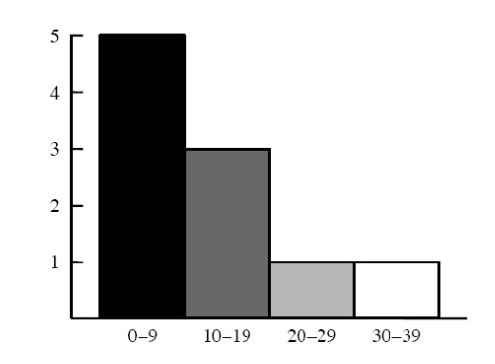
Figure 1: A histogram
Figure 1 is an example of histogram automatically produced by his histogram generator. A histogram is a visual display of frequencies of value occurrences as bars. In this example, values in the interval 0¨C9 occur five times, those in the interval 10¨C19 occur three times, and 20¨C29 and 30¨C39 once each. Dr. GreyˇŻs histogram generator is a simple tool. First, the height of the histogram is fixed, that is, the height of the highest bar is always the same and those of the others are automatically adjusted proportionately. Second, the widths of bars are also fixed. It can only produce a histogram of uniform intervals, that is, each interval of a histogram should have the same width (10 in the above example). Finally, the bar for each interval is painted in a grey color, where the colors of the leftmost and the rightmost intervals are black and white, respectively, and the darkness of bars monotonically decreases at the same rate from left to right. For instance, in Figure 1, the darkness levels of the four bars are 1, 2/3, 1/3, and 0, respectively. In this problem, you are requested to estimate ink consumption when printing a histogram on paper. The amount of ink necessary to draw a bar is proportional to both its area and darkness.
Figure 1 is an example of histogram automatically produced by his histogram generator. A histogram is a visual display of frequencies of value occurrences as bars. In this example, values in the interval 0¨C9 occur five times, those in the interval 10¨C19 occur three times, and 20¨C29 and 30¨C39 once each. Dr. GreyˇŻs histogram generator is a simple tool. First, the height of the histogram is fixed, that is, the height of the highest bar is always the same and those of the others are automatically adjusted proportionately. Second, the widths of bars are also fixed. It can only produce a histogram of uniform intervals, that is, each interval of a histogram should have the same width (10 in the above example). Finally, the bar for each interval is painted in a grey color, where the colors of the leftmost and the rightmost intervals are black and white, respectively, and the darkness of bars monotonically decreases at the same rate from left to right. For instance, in Figure 1, the darkness levels of the four bars are 1, 2/3, 1/3, and 0, respectively. In this problem, you are requested to estimate ink consumption when printing a histogram on paper. The amount of ink necessary to draw a bar is proportional to both its area and darkness.
Input
The input consists of multiple datasets, each of which contains integers and specifies a value table and intervals for the histogram generator, in the following format:
nw
v1
v2
.
.
.
vn
n is the total number of value occurrences for the histogram, and each of the n lines following the first line contains a single value. Note that the same value may possibly occur multiple times. w is the interval width. A value v is in the first (i.e. leftmost) interval if 0 ˇÜ v<w, the second one if w ˇÜ v< 2w, and so on. Note that the interval from 0 (inclusive) to w (exclusive) should be regarded as the leftmost even if no values occur in this interval. The last (i.e. rightmost) interval is the one that includes the largest value in the dataset.
You may assume the following:
1 ˇÜ n ˇÜ 100
10 ˇÜ w ˇÜ 50
0 ˇÜ vi ˇÜ 100
for 1 ˇÜ i ˇÜ n
You can also assume that the maximum value is no less than w. This means that the histogram has more than one interval. The end of the input is indicated by a line containing two zeros.
Output
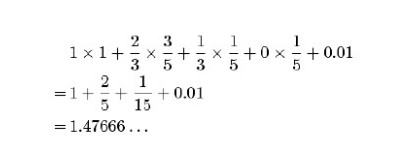
For each dataset, output a line containing the amount of ink consumed in printing the histogram. One unit of ink is necessary to paint one highest bar black. Assume that 0.01 units of ink per histogram is consumed for various purposes except for painting bars such as drawing lines and characters (see Figure 1). For instance, the amount of ink consumed in printing the histogram in Figure 1 is:
Each output value should be a 6 decimal fraction.
Each output value should be a 6 decimal fraction.
Sample Input
3 50
100
0
100
3 50
100
100
50
10 10
1
2
3
4
5
16
17
18
29
30
0 0
Sample Output
0.510000
0.260000
1.476667
Source
| Home | Top |
Hangzhou Dianzi University Online Judge 3.0 Copyright © 2005-2024 HDU ACM Team. All Rights Reserved. Designer & Developer : Wang Rongtao LinLe GaoJie GanLu Total 0.000000(s) query 1, Server time : 2024-11-25 02:07:52, Gzip enabled |
Administration |