
| Online Judge | Online Exercise | Online Teaching | Online Contests | Exercise Author |
|
F.A.Q Hand In Hand Online Acmers |
Best Coder beta VIP | STD Contests DIY | Web-DIY beta |
Statistical Problems
Time Limit: 6000/2000 MS (Java/Others) Memory Limit: 32768/32768 K (Java/Others)Total Submission(s): 728 Accepted Submission(s): 300
Problem Description
Last year Dige was having a statistic course and had to solve many problems and calculate many results. However, he thought it was worthless to practice that much since that after solving several problems, the rest was just repeating and repeating, which is too simple, sometimes naive. Therefore, he wanted someone to help him write a program, which would output all the results he needs immediately instead of calculating them himself.
The statistic problems might include z-scores, one-sample t-tests, correlation and regression.
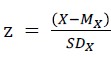
For a population of real numbers, the standard deviation (SD) of the numbers is defined as
You know, sometimes (almost always) we cannot get data for a whole population, and what we’ve got is just a sample from it. For a sample from a population, the SD is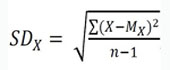

There are many ways to calculate a correlation coefficient between two variables X and Y, and one of the most popular one is Pearson’s r, which is
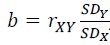
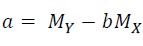
It is a little complicated for regression, which is meant to find the “best” a and b for the estimation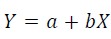
The statistic problems might include z-scores, one-sample t-tests, correlation and regression.
For a population of real numbers, the standard deviation (SD) of the numbers is defined as
You know, sometimes (almost always) we cannot get data for a whole population, and what we’ve got is just a sample from it. For a sample from a population, the SD is
There are many ways to calculate a correlation coefficient between two variables X and Y, and one of the most popular one is Pearson’s r, which is
It is a little complicated for regression, which is meant to find the “best” a and b for the estimation
Input
Inputs include multiple cases (no more than 100) and would end with EOF.
Each case starts with a line including two integers p and n. p indicates the kind of problem to solve, 1 means z-score, 2 means one-sample t-test, 3 means Pearson correlation, 4 means regression. n is the number of data points. n is no smaller than 2 and no larger than 10000.
If p is 1, then the following input of the case would be n numbers.
If p is 2, then the following input of the case would be (n + 1) numbers, the first one is the mean of the population and the rest are the data of the sample.
If p is 3 or 4, then the following input of the case would be 2 lines, each with n numbers. The first line are Xs and the second are Ys.
Note that inputs can be separated not only by spaces, but also tabs and new lines, or even combinations of them.
Output
For each case, print the output in one line, round all numbers to 2 decimal points, and separate them with spaces.
If p is 1, you should output the z-score for each number without changing their orders.
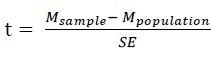
If p is 2, you should output the t-value.
If p is 3 or 4, output the Pearson’s r for them if p is 3, or a and b as is mentioned above if p is 4.
If p is 1, you should output the z-score for each number without changing their orders.
If p is 2, you should output the t-value.
If p is 3 or 4, output the Pearson’s r for them if p is 3, or a and b as is mentioned above if p is 4.
Sample Input
1 3
1 2 3

1 2
1 2

2 3
2 1 2 3

3 4
1 2 3 4
5 6 7 8

4 3
1 2 3
3 5 7
Sample Output
-1.22 0.00 1.22
-1.00 1.00
0.00
1.00
1.00 2.00
Hint
Output -0.00 as it is.
Author
Entheos
Source
| Home | Top |
Hangzhou Dianzi University Online Judge 3.0 Copyright © 2005-2024 HDU ACM Team. All Rights Reserved. Designer & Developer : Wang Rongtao LinLe GaoJie GanLu Total 0.000000(s) query 1, Server time : 2024-11-22 09:44:52, Gzip enabled |
Administration |