
| Online Judge | Online Exercise | Online Teaching | Online Contests | Exercise Author |
|
F.A.Q Hand In Hand Online Acmers |
Best Coder beta VIP | STD Contests DIY | Web-DIY beta |
Online Shopping
Time Limit: 2000/1000 MS (Java/Others) Memory Limit: 32768/32768 K (Java/Others)Total Submission(s): 342 Accepted Submission(s): 81
Problem Description
The Internet becomes more and more important for our daily life. Aside from information retrieval, many people use the web for comfortable shopping from their home PCs. As the number of online customers grows, so does the number of websites dedicated to comparing online prices. Competitive sites need to quickly visualize the cheapest offers for a certain product. Barter & Haggle Inc. has recently been successful in the field of comparing online prices. However, as more and more comparable services appear, B&H has trouble conserving their market share. This is why the company has decided to improve its technology by comparing prices for different online shops and products simultaneously. The engineers have not been capable of implementing the visualization algorithm, though. This is where you come into play.
Given a table of prices for different products at different online stores, you need to find an optimal reordering of the rows and columns. In order to compare different reorderings, we define the table string to be the string of cells that is obtained from a table by appending all columns. An optimal reordering has the smallest table string with respect to lexicographical comparison (the table string is compared cell-wise).
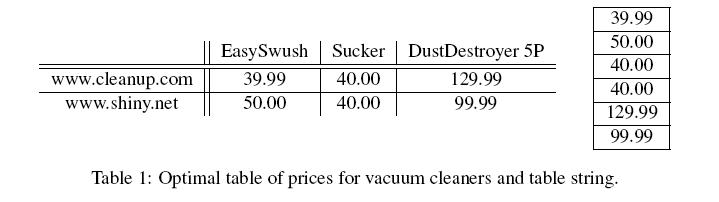
Given a table of prices for different products at different online stores, you need to find an optimal reordering of the rows and columns. In order to compare different reorderings, we define the table string to be the string of cells that is obtained from a table by appending all columns. An optimal reordering has the smallest table string with respect to lexicographical comparison (the table string is compared cell-wise).
Input
The inputs start with a line containing a single integer n. Each of the n following lines contains one test case. Each test case starts with two integers 1 <= a, b <= 5, the number of products and online shops respectively.
The table string consisting of the prices separated by single spaces follows. Each price p is given as an integer amount of cents with 0 <= p <= 109.
The table string consisting of the prices separated by single spaces follows. Each price p is given as an integer amount of cents with 0 <= p <= 109.
Output
The output for every test case begins with a line containing “Scenario #i:”, where i is the number of the test case counting from 1. Then, output a single line containing the table string of the optimal reordering of products and shops. Terminate each test case with an empty line.
Sample Input
2
3 2 3999 5000 4000 4000 12999 9999
4 3 120 120 110 120 80 75 250 50 200 55 80 80
Sample Output
Scenario #1:
3999 5000 4000 4000 12999 9999

Scenario #2:
50 200 250 80 75 120 80 80 55 120 110 120
Source
| Home | Top |
Hangzhou Dianzi University Online Judge 3.0 Copyright © 2005-2024 HDU ACM Team. All Rights Reserved. Designer & Developer : Wang Rongtao LinLe GaoJie GanLu Total 0.000000(s) query 1, Server time : 2024-11-22 15:03:03, Gzip enabled |
Administration |